
Human reaction time changes across the lifespan. Response speed generally improves through childhood and adolescence, is often fastest in young adulthood, and then gradually becomes slower and more variable through middle and older adulthood. However, there is no single “normal” reaction-time number for every person of a particular age. Test design, device latency, sleep, focus, practice, and physical condition can all affect the displayed result.
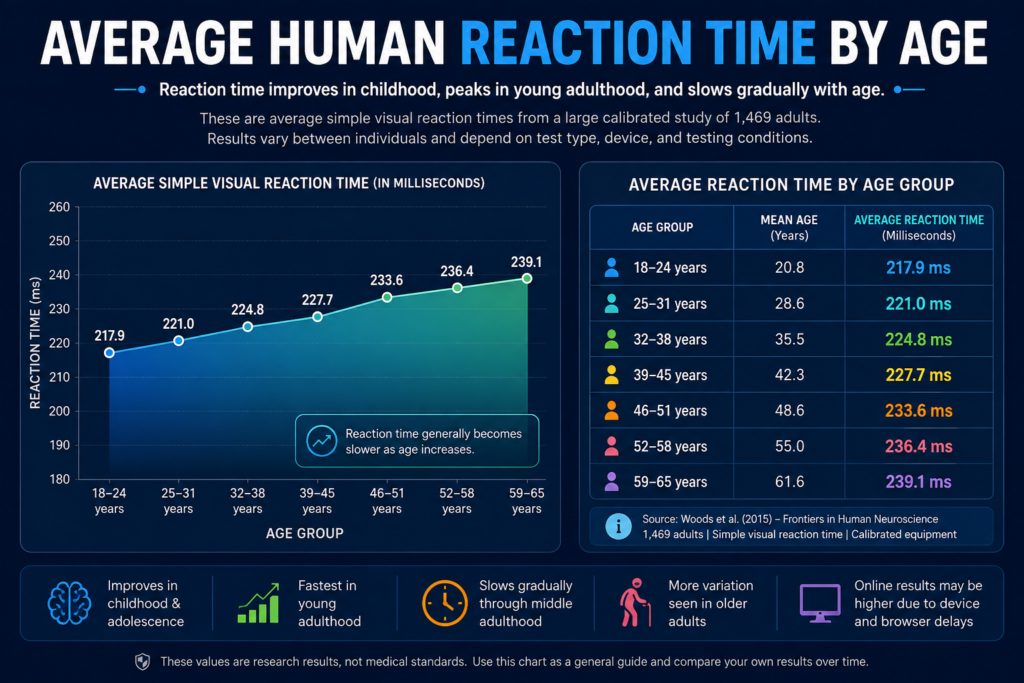
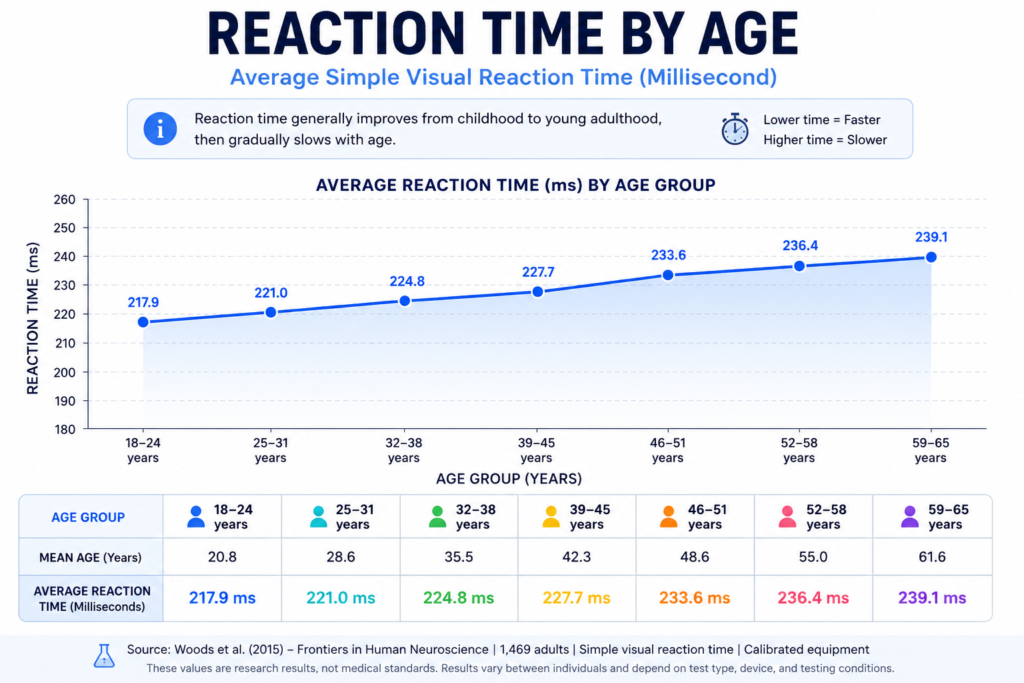
In one large, carefully calibrated study of adults aged 18 to 65, average simple visual reaction time increased from approximately 218 milliseconds among participants aged 18–24 to approximately 239 milliseconds among those aged 59–65. The researchers calculated an average age-related increase of about 0.55 milliseconds per year, although individual results varied considerably.
Quick answer: Reaction time usually becomes faster from childhood into young adulthood. It then slows gradually across adulthood, with greater differences often appearing in complex tasks and among older adults.
Average Reaction Time by Age Chart
The following results come from a calibrated simple visual reaction-time study involving 1,469 adults. Participants responded to a predictable visual stimulus, so these values should not be directly compared with choice, gaming or decision-based reaction tasks.
| Age group | Mean age | Average simple reaction time |
|---|---|---|
| 18–24 years | 20.8 | 217.9 ms |
| 25–31 years | 28.6 | 221.0 ms |
| 32–38 years | 35.5 | 224.8 ms |
| 39–45 years | 42.3 | 227.7 ms |
| 46–51 years | 48.6 | 233.6 ms |
| 51–58 years | 55.0 | 236.4 ms |
| 59–65 years | 61.6 | 239.1 ms |
The same researchers estimated that the physical equipment introduced approximately 18 milliseconds of delay. After adjustment, results ranged from around 200 ms in the youngest adult group to approximately 222 ms in the oldest group. This demonstrates why a calibrated laboratory result may be faster than a score recorded through an ordinary browser, monitor, and input device.
These values are research results from one particular test—not universal medical standards or guaranteed averages for every age.
How Reaction Time Changes Throughout Life
Reaction time does not suddenly become slow at a particular birthday. It follows a gradual developmental and age-related pattern.
Childhood
Young children generally respond more slowly than teenagers and young adults. Their sensory processing, attention, motor coordination and ability to understand testing instructions are still developing.
Research on processing speed across the lifespan indicates that response speed improves systematically from childhood through adolescence before reaching its fastest general level in young adulthood. The size of the difference depends heavily on the difficulty of the task.
A developmental motor study found that older children responded faster than younger children. In one testing condition, the mean result improved from approximately 282 ms at ages 7–8 to 257 ms at ages 11–12, while participants aged 13–14 reached a result closer to the adult group. The researchers also found differences between controlled laboratory and public testing environments, showing that concentration and testing conditions matter.
Children’s scores should therefore be interpreted cautiously. A young child may need additional time to understand the instructions, maintain attention and coordinate the required movement.
Teenagers
Reaction speed generally continues to improve during adolescence as attention, coordination and processing skills develop.
Teenagers may record results close to young-adult levels on a simple, familiar test. However, individual differences can be much larger than the average difference between two nearby age groups.
A teenager who frequently plays fast-paced games or practises a reaction test may outperform an unfamiliar adult user. That does not mean age has no effect; it means age is only one of several influences on a score.
Young adults
Young adulthood is commonly associated with the fastest average reaction times. In the calibrated adult study, the youngest group—ages 18 to 24—recorded an average of approximately 217.9 ms before hardware correction.
Young adults may benefit from:
- Fully developed motor coordination
- Faster movement initiation
- Strong processing speed
- Greater familiarity with computers and games
- Fewer age-related changes in movement
Nevertheless, a young adult can still receive a slow score because of tiredness, distraction, device delay or an unfamiliar testing process.
Middle-aged adults
Reaction time generally becomes gradually slower during middle adulthood rather than changing abruptly.
In the calibrated study, average results increased from around 227.7 ms among participants aged 39–45 to 236.4 ms in the group with a mean age of 55. The difference was measurable across a large sample, but relatively modest compared with the variations that can occur between individuals or devices.
This means a healthy middle-aged adult may still record a faster score than many younger participants.
Older adults
Reaction time tends to become slower and more variable among older adults. A major analysis of 7,130 adults found that reaction times generally slowed and became less consistent with increasing age.
A systematic review also found that adults aged 60 and above showed greater attempt-to-attempt variation than younger and middle-aged adults. Age differences were larger in choice tasks than in simple tasks, suggesting that selecting between multiple responses may produce a greater age-related difference than responding to one predictable signal.
Recent motor research indicates that age-related increases in simple reaction time may involve slower preparation and movement processes, not merely a delay in noticing the stimulus.
A slower browser-test result alone does not indicate poor health or inability. It should be treated as a casual measurement rather than a medical assessment.
Why Does Reaction Time Become Slower With Age?
Age-related reaction-time differences can involve several stages between seeing a stimulus and completing a response.
Movement preparation
Before clicking, tapping or pressing a key, the nervous system must prepare the movement. Research suggests that slower response preparation contributes to age-related increases in reaction time.
Motor response
The Woods study found that age-related slowing in its simple task was primarily associated with motor output. The estimated time needed to detect the stimulus remained relatively stable, while movement-related components became slower.
Task complexity
Age differences usually become more noticeable when the user must select between several responses, ignore irrelevant signals or change rules during the task.
A simple test requires one known response. A choice test requires additional identification and decision-making, so it normally takes longer. Studies comparing age groups show larger age-related differences as task complexity increases.
Speed–accuracy strategy
Some older users may respond more cautiously to avoid making errors. A more careful strategy can produce a slower time even when the person detected the stimulus quickly.
A slower result is not always worse if it is accompanied by greater accuracy.
Why Online Age Charts Are Only Estimates
An online reaction-time score includes more than the user’s biological response.
The displayed result can contain delays from:
- Monitor refresh timing
- Browser processing
- Operating-system scheduling
- Mouse or keyboard input
- Touchscreen processing
- Background applications
- The test’s JavaScript implementation
Modern online testing platforms can record manual response times with reasonable accuracy, but no single browser, operating system or device performs best under every condition.
Tablet tests can introduce substantial differences between devices. One validation study measured errors ranging from roughly 30 to 100 ms during simulated 250 ms touchscreen responses, depending on the tablet.
For this reason, you should not assume that a person aged 25 must receive the exact average shown in a research table.
Can You Compare Your Result With the Age Chart?
You can use the chart as general context, but it should not be treated as a pass-or-fail standard.
A meaningful comparison requires the same:
- Type of reaction task
- Input method
- Number of attempts
- Device
- Browser
- Testing environment
- Score calculation method
The research table measures simple visual reaction time using calibrated equipment. Your browser result may include additional hardware and software delay.
A result that is 20 or 40 ms above a study average does not automatically mean your biological reaction is unusually slow.
What Is a Good Reaction Time for Your Age?
There is no universal score that separates good and bad reaction time at every age.
A better approach is to consider three comparisons.
Compare with a broad research range
Use age-based research to understand the general lifespan trend, not to diagnose your performance.
Compare with your own previous results
Personal comparison is often more useful than comparing yourself with strangers using unknown devices.
Record:
- Your five-attempt average
- Median result
- Best attempt
- Slowest attempt
- Consistency
- Device used
- Approximate testing conditions
Compare repeated sessions
Complete several sessions on different days. One session may be affected by sleep, concentration, stress, or temporary device load.
A stable personal average is more informative than one unusually fast or slow click.
Average Reaction Time for Children
There is no reliable single browser-test average that applies to every child.
Children’s results change quickly with development, and performance can be influenced by:
- Understanding the instructions
- Attention span
- Hand size
- Device familiarity
- Motor coordination
- Motivation
- Test complexity
Research supports a general pattern of faster responses as children become older, but exact results should be compared only when the same test and conditions are used.
An online score should not be used to assess a child’s development or health.
Average Reaction Time for Teenagers
Many teenagers can achieve results close to young-adult averages on simple visual tasks.
Practice with games, computers, and mobile devices may also improve familiarity with quick screen-based responses. However, gaming experience does not remove normal variation caused by sleep, focus, device latency, or anticipation.
A teenager should complete at least five valid attempts and focus on the average rather than one fastest click.
Average Reaction Time for Adults
In calibrated simple visual testing, many adult averages fall within approximately 200–250 ms, with gradual increases across the adult age groups.
Online averages may be higher because browser and device delays are included. The result is still useful for personal tracking when the same setup is used each time.
Average Reaction Time After Age 60
Adults over 60 may take slightly longer and show greater variation between attempts, particularly in tasks involving several choices.
However, age does not determine an individual result. Sleep, fitness, health, familiarity, and testing equipment can produce substantial differences between two people of the same age.
A person over 60 can still record a faster score than a younger adult.
Does Gender Affect Reaction Time?
Research findings on gender and reaction time vary by sample and task.
In the calibrated simple visual study of 1,469 adults, reaction time increased with age but was not significantly affected by sex or education. Other large studies using different tasks have reported some sex differences.
This disagreement is another reason not to apply one universal benchmark to every user.
How to Measure Your Reaction Time Fairly
Follow a consistent testing process:
- Use the same computer or phone each time.
- Use the same mouse, keyboard, or touchscreen.
- Close unnecessary programs and browser tabs.
- Remove notifications and distractions.
- Complete one practice attempt.
- Complete five valid recorded attempts.
- Do not guess when the signal will appear.
- Compare your average and median.
- Retest at a similar time of day.
- Keep a record of multiple sessions.
These steps cannot remove every hardware delay, but they make personal comparisons more consistent.
Should You Use the Average, Median or Best Score?
Your average uses all valid attempts and provides a useful summary of the complete session.
Your median is the middle result after the attempts are arranged from fastest to slowest. It is less affected by one unusually fast or slow attempt.
Your best score represents peak performance but may not represent your usual response speed.
For age comparisons, average and median are generally more informative than the single fastest result.
Test Your Reaction Time
Use the Reaction Time Test on the homepage to complete five visual-response attempts and review your:
- Average
- Median
- Best result
- Slowest result
- Consistency
- Attempt-by-attempt graph
For a fair comparison, use the same device and repeat the test under similar conditions.
Test Your Reaction TimeFrequently Asked Questions
What is the average human reaction time by age?
Reaction time generally improves from childhood to young adulthood and then becomes gradually slower. In one calibrated adult study, average simple visual reaction time increased from about 218 ms at ages 18–24 to about 239 ms at ages 59–65.
At what age is reaction time fastest?
Reaction time is generally fastest during young adulthood, although the exact peak varies by task, individual, and testing method. Lifespan research shows improvement through childhood and adolescence, followed by gradual slowing during adulthood.
What is a good reaction time for a teenager?
Many teenagers can achieve simple visual reaction times close to young-adult results. A score should be interpreted using several attempts on the same device rather than a single universal teenage benchmark.
What is a good reaction time for an adult?
A simple visual result around 200–250 ms is generally fast in calibrated testing. Online browser scores may be higher because of display and input delay.
Does reaction time get slower after 30?
Research indicates that reaction time becomes gradually slower across adulthood rather than suddenly changing at age 30. The average difference per year is small, but it becomes measurable across larger age ranges.
Does reaction time decline after 40?
A gradual decline can continue through middle age. However, individual and device differences may be greater than the average difference between nearby age groups.
What is the average reaction time for people over 60?
In one simple visual study, adults aged 59–65 averaged approximately 239 ms before equipment-delay correction. Results for older age groups depend strongly on the task, particularly whether it requires one response or several choices.
Why is my score slower than the average for my age?
Tiredness, distraction, limited practice, cautious responding, monitor latency, input-device delay, and browser performance can all raise an online result.
Can an older person have a faster reaction time than a younger person?
Yes. Age affects group averages, but it does not determine every individual result. Practice, health, focus, fitness, and equipment can produce substantial variation.
Should children use an online reaction test?
Children can use a test for casual interest with appropriate supervision, but the result should not be treated as a developmental or medical assessment.
Is reaction time a medical test?
No. A browser reaction test is intended for casual measurement and personal comparison. It cannot diagnose a neurological, developmental, or medical condition.
How many attempts should I complete?
Complete at least five valid attempts. Use the average and median to understand the full session rather than relying on one fastest result.
Conclusion
Average human reaction time changes gradually with age.
Response speed generally improves through childhood and adolescence, reaches its fastest average level in young adulthood, and then becomes progressively slower and more variable through middle and older adulthood.
A large calibrated study found adult simple visual averages ranging from approximately 218 ms at ages 18–24 to 239 ms at ages 59–65. However, these figures are not universal standards. Online results can be higher because of monitor, browser, operating-system, and input-device delays.
Use age charts as general educational context. For meaningful progress tracking, complete several attempts and compare your own average under similar conditions.